Analytics is not enabled for your account by default, it is an extra service that is activated by request. Please create a support ticket to activate this.
Do you track user data? Rendered does not track any personal or private user data. We for example do not track IP addresses and for this reason, also don't provide statistics on new or returning users.
What are analytics?
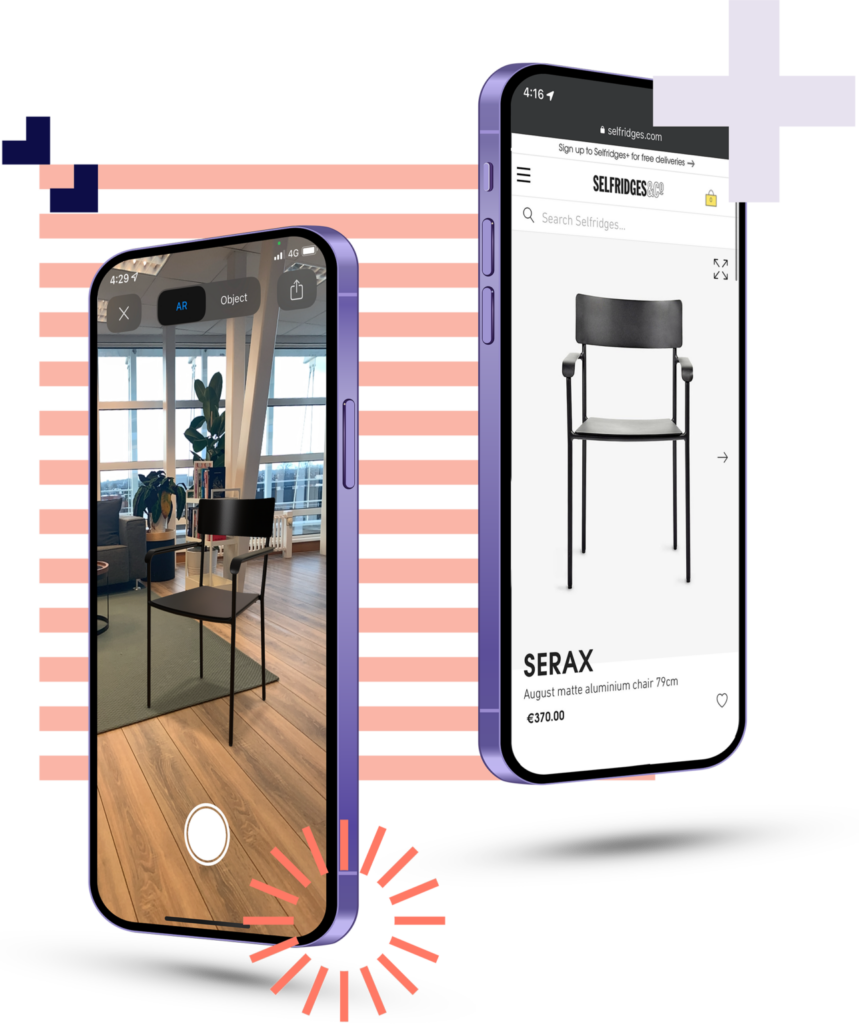
Analytics are statistics that help you see insights and meaningful data regarding the overall performance of your embedded 3D and AR viewers. If you are familiar with website analytics then you won’t have any issues understanding the embed analytics.
Which analytics are available?
Rendered provides basic but detailed analytics for your embedded 3D and AR viewers. Currently there are 5 different statistics that are tracked, please see below:
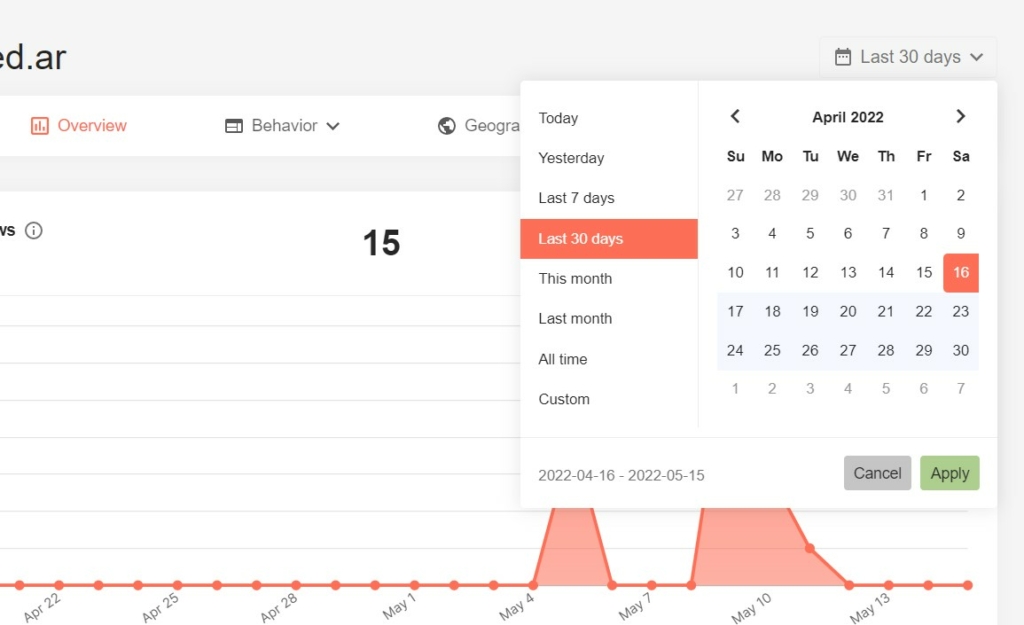
Overview
This is your analytics dashboard, here you’ll find an overview of the statistics that are tracked. You can filter based on the date and time frame at the top right of the screen.
Pages
Embed views are the number of views that your various 3D and AR viewers have received. The pages tab allows you to view the number of views per page and also gives you the most and least popular products that have been viewed in the selected time frame.
Geographic
These stats include the continent, country, city and language statistics from the users that have viewed your products.
Technology
You can find all technical statistics such as the devices, operating system and screen sizes used here.
Events
This is currently not used by Rendered. In the near future, this will be added to allow specific user events to be tracked.
You are also able to see the real-time statistics of all your embedded 3D and AR viewers. This looks at the current and last 60 seconds of data.